Geology and mineral resources industry include: geological and geochemical survey, mining exploration, mineral processing, smelting, X fluorescence analysis can be applied to each link, it has a simple sample preparation, fast analysis speed, high precision, etc, can replace the traditional chemical analysis method, bring huge economic benefits, geology and mineral resources industry including non-ferrous minerals (copper, lead and zinc, etc) and black mineral (iron) industry.
Application solutions:
Iron ore analysis:
The ELITE 600 instrument is mainly concerned with the grade of iron in the analysis of iron ore and iron fine powder samples. Other impurity elements also need to be quantitatively measured, which requires analysis of molten samples. Therefore, the ELITE 600 X fluorescence analyzer with high precision is the first choice.
For simple iron mines, direct tablet pressing can be used for rapid determination, while for iron ore and iron fine powder from complex sources, flake melting can be used for accurate determination.
The measurement spectrum of iron ore is as follows: The working curve of Fe:
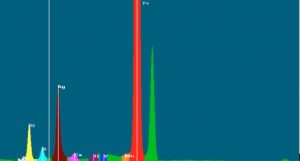
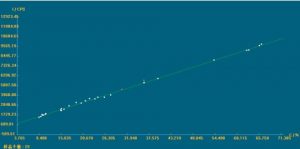
(note: Ag is the target peak of X-ray tube, not the component in the sample)
Analysis and comparison results of iron fine powder samples:
| Sample number | Analysis method | TFe(%) | SiO2(%) | CaO(%) | Al2O3(%) | TiO2(%) |
| 1# | fluorescent | 66.13 | 4.98 | 0.17 | 0.23 | 0.034 |
| chemical | 66.18 | 4.79 | 0.18 | 0.22 | 0.032 | |
| 2# | fluorescent | 64.35 | 9.59 | 0.95 | 1.56 | 0.078 |
| chemical | 64.58 | 9.82 | 0.88 | 1.45 | 0.067 | |
| 3# | fluorescent | 61.89 | 7.17 | 1.18 | 0.78 | 0.120 |
| chemical | 61.73 | 7.01 | 1.16 | 0.70 | 0.110 | |
| 4# | fluorescent | 66.37 | 5.02 | 0.87 | 0.45 | 0.140 |
| chemical | 66.13 | 4.93 | 0.94 | 0.53 | 0.134 | |
| 5# | fluorescent | 63.25 | 3.28 | 0.56 | 0.98 | 0.059 |
| chemical | 63.42 | 3.38 | 0.64 | 1.02 | 0.065 |
铁矿石样品分析结果如下:
| sample name | Analysis method | TFe(%) | SiO2(%) | P(%) | S(%) | TiO2(%) |
| W07218 | Fluorspar light | 66.06 | 3.01 | 0.03 | 0.01 | 0.33 |
| study | 65.75 | 2.85 | 0.05 | 0.02 | 0.29 | |
| 2513A | Fluorspar light | 15.48 | 63.16 | 0.19 | 0.02 | 0.65 |
| study | 15.70 | 62.97 | 0.20 | 0.04 | 0.61 | |
| 2514A | Fluorspar light | 30.81 | 39.26 | 0.61 | 0.03 | 0.29 |
| study | 30.60 | 39.54 | 0.54 | 0.02 | 0.28 | |
| 2357A | Fluorspar light | 51.87 | 3.34 | 0.98 | 0.14 | 0.26 |
| study | 51.65 | 3.50 | 0.92 | 0.11 | 0.21 | |
| 2516A | Fluorspar light | 19.98 | 53.69 | 0.34 | 0.06 | 0.78 |
| study | 20.10 | 53.42 | 0.34 | 0.09 | 0.81 |
Tungsten sample analysis
One is mine, the analysis of the mill plant, features are: mineral structure is relatively simple, but the process sample sort is more, mainly include: sand, coarse sand and fine wool, fine, fine ore concentrate, middlings, table of middlings was concentrate, magnetic concentrate, export tungsten concentration, molybdenum concentration and bismuth concentration, such as waste rock samples, there are a dozen samples, general requirements, respectively, curve calibration workload is bigger.
The other type of tungsten smelter is characterized by the analysis of concentrate only, especially tungsten concentrate, but the source is more complex. There are two kinds of tungsten concentrates, scheelite and wolfram, in different mines in different regions.
The analysis of ELITE 600 instrument, tungsten ore and tungsten fine powder samples is mainly concerned with the grade of tungsten, and other impurity elements also need to be quantitatively measured. Direct tablet analysis can be used, and the ELITE 600 X fluorescence analyzer with high precision can fully meet the analysis requirements.
Wolfram sample analysis
Measurement spectrum:

comparison results are as follows:
| sample name | methods | WO3 | S | P | As | Mo | Cu | Sn | SiO2 | Sb | Ca |
| 2012-17-33 | study | 68.28 | 0.750 | 0.030 | 0.120 | 0.010 | 0.095 | 0.270 | 4.610 | 0.005 | 0.340 |
| Fluorspar light | 67.97 | 0.769 | 0.030 | 0.110 | 0.013 | 0.094 | 0.277 | 4.302 | 0.008 | 0.355 | |
| Poor miss | -0.31 | 0.019 | 0.000 | -0.010 | 0.003 | -0.001 | 0.007 | -0.308 | 0.003 | 0.015 | |
| 2011-17-83 | study | 68.76 | 1.000 | 0.030 | 0.330 | 0.014 | 0.095 | 0.280 | 3.380 | 0.012 | 0.250 |
| Fluorspar light | 68.95 | 0.939 | 0.030 | 0.195 | 0.014 | 0.086 | 0.278 | 3.066 | 0.008 | 0.285 | |
| Poor miss | 0.19 | -0.061 | 0.000 | -0.135 | 0.000 | -0.009 | -0.002 | -0.314 | -0.004 | 0.035 | |
| 2011-17-108 | study | 70.48 | 0.710 | 0.030 | 0.100 | 0.010 | 0.080 | 0.190 | 1.950 | 0.005 | 0.340 |
| Fluorspar light | 70.89 | 0.763 | 0.030 | 0.101 | 0.009 | 0.082 | 0.224 | 2.172 | 0.005 | 0.387 | |
| Poor miss | 0.41 | 0.053 | 0.000 | 0.001 | -0.001 | 0.002 | 0.034 | 0.222 | 0.000 | 0.047 | |
| 2012-17-34 | study | 67.55 | 0.900 | 0.030 | 0.130 | 0.110 | 4.820 | 0.005 | 0.380 | ||
| Fluorspar light | 67.54 | 0.860 | 0.031 | 0.141 | 0.125 | 4.738 | 0.007 | 0.463 | |||
| Poor miss | -0.02 | -0.040 | 0.001 | 0.011 | 0.015 | -0.082 | 0.002 | 0.083 | |||
| 2011-17-28 | study | 68.02 | 0.940 | 0.030 | 0.170 | 0.015 | 0.130 | 0.260 | 3.750 | 0.006 | 0.470 |
| Fluorspar light | 68.29 | 0.902 | 0.030 | 0.221 | 0.015 | 0.116 | 0.220 | 3.995 | 0.007 | 0.370 | |
| Poor miss | 0.27 | -0.038 | 0.000 | 0.051 | 0.000 | -0.014 | -0.040 | 0.245 | 0.001 | -0.100 | |
| 2011-17-187 | study | 69.08 | 0.980 | 0.030 | 0.200 | 0.011 | 0.083 | 0.270 | 3.000 | 0.006 | 0.370 |
| Fluorspar light | 69.16 | 0.893 | 0.030 | 0.181 | 0.012 | 0.087 | 0.274 | 3.249 | 0.006 | 0.365 | |
| Poor miss | 0.08 | -0.087 | 0.000 | -0.019 | 0.001 | 0.004 | 0.004 | 0.249 | 0.000 | -0.005 | |
| 2012-17-28 | study | 68.65 | 0.750 | 0.030 | 0.130 | 0.110 | 0.300 | 3.310 | 0.006 | 0.340 | |
| Fluorspar light | 68.92 | 0.771 | 0.030 | 0.113 | 0.112 | 0.322 | 3.676 | 0.008 | 0.470 | ||
| Poor miss | 0.27 | 0.021 | 0.000 | -0.017 | 0.002 | 0.022 | 0.366 | 0.002 | 0.130 | ||
| 2012-17-26 | study | 68.41 | 0.740 | 0.030 | 0.130 | 0.081 | 0.310 | 3.930 | 0.005 | 0.350 | |
| Fluorspar light | 68.42 | 0.816 | 0.030 | 0.125 | 0.086 | 0.297 | 4.142 | 0.008 | 0.452 | ||
| Poor miss | 0.01 | 0.076 | 0.000 | -0.005 | 0.005 | -0.013 | 0.212 | 0.003 | 0.102 |
Analysis of scheelite concentrate
Measurement spectrum:
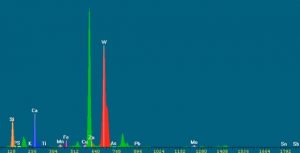
comparison results are shown in the following table:
| sample name | methods | WO3 | S | P | As | Mo | Cu | Sn | SiO2 | Sb | Ca | Fe | Mn |
| xq031101073 | study | 53.24 | 0.71 | 0.020 | 0.015 | 0.620 | 0.540 | 0.033 | 0.10 | 0.004 | 20.79 | 0.59 | 0.150 |
| Fluorspar light | 52.46 | 0.81 | 0.040 | 0.025 | 0.605 | 0.583 | 0.033 | 0.26 | 0.003 | 21.47 | 0.66 | 0.267 | |
| Poor miss | -0.78 | 0.10 | 0.020 | 0.010 | -0.015 | 0.043 | 0.000 | 0.16 | -0.001 | 0.68 | 0.07 | 0.117 | |
| xq021201004 | study | 65.64 | 0.55 | 0.056 | 0.019 | 0.640 | 0.200 | 0.030 | 0.83 | 0.004 | 17.89 | 0.37 | 0.062 |
| Fluorspar light | 64.91 | 0.78 | 0.040 | 0.022 | 0.621 | 0.183 | 0.016 | 1.08 | 0.001 | 18.71 | 0.40 | 0.082 | |
| Poor miss | -0.73 | 0.23 | -0.016 | 0.003 | -0.019 | -0.017 | -0.014 | 0.25 | -0.003 | 0.82 | 0.03 | 0.020 | |
| xq021201005 | study | 59.64 | 0.51 | 0.099 | 0.017 | 0.610 | 0.190 | 0.032 | 0.63 | 0.004 | 20.12 | 0.38 | 0.120 |
| Fluorspar light | 59.26 | 0.76 | 0.093 | 0.023 | 0.625 | 0.200 | 0.025 | 0.79 | 0.003 | 20.64 | 0.37 | 0.162 | |
| Poor miss | -0.38 | 0.25 | -0.006 | 0.006 | 0.015 | 0.010 | -0.007 | 0.16 | -0.001 | 0.52 | -0.01 | 0.042 | |
| xq011101065 | study | 54.22 | 2.04 | 0.073 | 0.015 | 0.500 | 0.055 | 0.032 | 0.47 | 0.004 | 21.92 | 1.69 | 0.130 |
| Fluorspar light | 53.48 | 1.76 | 0.089 | 0.027 | 0.453 | 0.050 | 0.020 | 0.90 | 0.006 | 21.29 | 1.63 | 0.250 | |
| Poor miss | -0.74 | -0.28 | 0.016 | 0.012 | -0.047 | -0.005 | -0.012 | 0.43 | 0.002 | -0.64 | -0.07 | 0.120 | |
| xq021201002 | study | 61.88 | 0.53 | 0.096 | 0.017 | 0.540 | 0.180 | 0.032 | 0.72 | 0.004 | 19.59 | 0.39 | 0.085 |
| Fluorspar light | 61.59 | 0.71 | 0.086 | 0.023 | 0.566 | 0.185 | 0.026 | 0.92 | 0.003 | 20.42 | 0.38 | 0.101 | |
| Poor miss | -0.29 | 0.18 | -0.010 | 0.006 | 0.026 | 0.005 | -0.006 | 0.20 | -0.001 | 0.83 | -0.01 | 0.016 | |
| xq031101066 | study | 52.72 | 0.94 | 0.040 | 0.038 | 0.580 | 0.600 | 0.033 | 0.32 | 0.004 | 20.42 | 0.72 | 0.083 |
| Fluorspar light | 53.02 | 1.02 | 0.023 | 0.050 | 0.600 | 0.634 | 0.036 | 0.41 | 0.005 | 20.20 | 0.71 | 0.102 | |
| Poor miss | 0.30 | 0.08 | -0.017 | 0.012 | 0.020 | 0.034 | 0.003 | 0.09 | 0.000 | -0.22 | -0.01 | 0.019 |
Lead zinc copper sample analysis
Edx-6800 instrument, the analysis of lead and zinc ore, mainly concerned with the grade of lead, zinc, copper, other impurity elements also need to be quantitatively measured, can use direct tablet analysis, so the use of edx-6800 X fluorescence analyzer can fully meet the analysis requirements.
铜原矿
Copper samples are generally symbiotic with zinc, lead, iron, sulfur and other useful elements. The content of each element can be analyzed at one time by using edx-6800 X fluorescence analyzer.
The measurement spectrum of copper raw ore is shown below
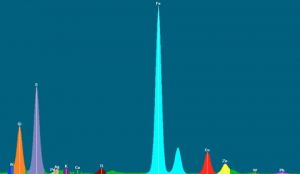
In the copper ore, three elements are mainly analyzed here: copper, zinc and lead.It only takes 200 seconds to directly analyze the contents of each element.
working curve of copper is as follows working curve of zinc is as follows: lead
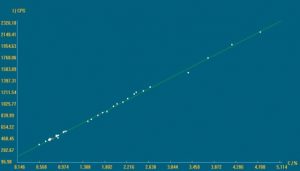
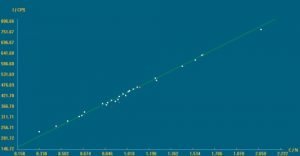
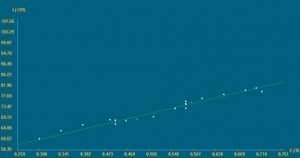
Actual sample comparison results
| Sample number | Analysis method | Cu(%) | Zn(%) | Pb(%) |
| 1 | Analysis method | 1.11 | 0.81 | 0.42 |
| fluorescent | 1.13 | 0.82 | 0.45 | |
| 2 | Analysis method | 0.75 | 0.68 | 0.30 |
| fluorescent | 0.75 | 0.71 | 0.32 | |
| 3 | Analysis method | 0.92 | 1.60 | 0.38 |
| fluorescent | 0.93 | 1.64 | 0.40 | |
| 4 | Analysis method | 1.83 | 1.00 | 0.56 |
| fluorescent | 1.76 | 0.96 | 0.52 | |
| 5 | Analysis method | 2.13 | 0.94 | 0.57 |
| fluorescent | 2.03 | 0.91 | 0.57 | |
| 6 | Analysis method | 4.17 | 0.46 | 0.68 |
| fluorescent | 4.22 | 0.48 | 0.69 |
Copper concentrate
Copper concentrate is the product of copper ore after flotation. Here, copper, zinc and lead are analyzed. The analytical spectrum is as follows:
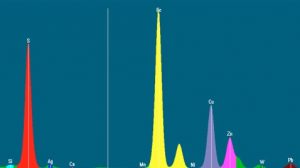
Actual sample comparison results
| Sample number | Analysis method | Cu(%) | Zn(%) | Pb(%) |
| 1 | chemical | 13.34 | 9.18 | 3.70 |
| fluorescent | 13.18 | 9.04 | 3.63 | |
| 2 | chemical | 12.49 | 10.66 | 4.35 |
| fluorescent | 12.44 | 10.72 | 4.50 | |
| 3 | chemical | 8.20 | 7.14 | 6.93 |
| fluorescent | 8.46 | 7.31 | 6.82 | |
| 4 | chemical | 11.97 | 7.45 | 0.14 |
| fluorescent | 12.04 | 7.45 | 0.21 | |
| 5 | chemical | 19.86 | 6.93 | 6.49 |
| fluorescent | 19.78 | 7.07 | 6.36 | |
| 6 | chemical | 21.03 | 0.97 | 5.17 |
| fluorescent | 20.97 | 0.87 | 5.25 |
Copper tailings
Copper tailingsCopper tailings
Its fluorescence spectrum is as follows:
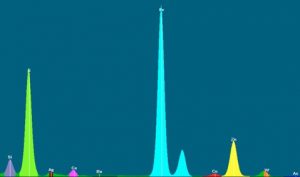
Actual sample comparison results
| Sample number | Analysis method | Cu(%) | Zn(%) |
| 1 | chemical | 0.12 | 7.43 |
| fluorescent | 0.13 | 7.26 | |
| 2 | chemical | 0.07 | 6.66 |
| fluorescent | 0.06 | 6.62 | |
| 3 | chemical | 0.10 | 7.75 |
| fluorescent | 0.09 | 7.66 | |
| 4 | chemical | 0.08 | 8.31 |
| fluorescent | 0.08 | 8.38 | |
| 5 | chemical | 0.06 | 5.42 |
| fluorescent | 0.08 | 5.35 | |
| 6 | chemical | 0.10 | 6.48 |
| fluorescent | 0.11 | 6.53 |
Zinc concentrate
Zinc concentrate is the zinc powder selected after copper dressing. In addition to analyzing copper and zinc, Cd element can also be analyzed.
Its fluorescence spectrum is as follows:

Actual sample comparison results:
| Sample number | Analysis method | Cu(%) | Zn(%) | Cd(%) |
| 1 | chemical | 1.77 | 44.04 | 0.17 |
| fluorescent | 1.76 | 44.07 | 0.16 | |
| 2 | chemical | 1.94 | 36.41 | 0.14 |
| fluorescent | 1.93 | 36.33 | 0.13 | |
| 3 | chemical | 1.22 | 20.68 | 0.08 |
| fluorescent | 1.23 | 20.63 | 0.07 | |
| 4 | chemical | 1.10 | 25.13 | 0.10 |
| fluorescent | 1.07 | 25.06 | 0.09 | |
| 5 | chemical | 0.93 | 29.70 | 0.12 |
| fluorescent | 0.92 | 29.63 | 0.11 | |
| 6 | chemical | 1.28 | 15.19 | 0.06 |
| fluorescent | 1.29 | 15.17 | 0.05 |
Zinc tailings
Zinc tailings are the tailings after zinc dressing, and the content of zinc and copper is low.
Its fluorescence spectrum is as follows:
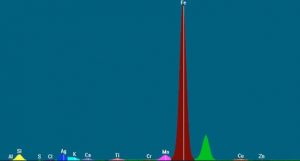
Actual sample comparison results
| Sample number | Analysis method | Cu(%) | Zn(%) |
| 1 | chemical | 0.06 | 0.06 |
| fluorescent | 0.05 | 0.08 | |
| 2 | chemical | 0.06 | 0.05 |
| fluorescent | 0.07 | 0.05 | |
| 3 | chemical | 0.03 | 0.07 |
| fluorescent | 0.02 | 0.05 | |
| 4 | chemical | 0.03 | 0.10 |
| fluorescent | 0.03 | 0.11 | |
| 5 | chemical | 0.07 | 0.09 |
| fluorescent | 0.08 | 0.09 | |
| 6 | chemical | 0.06 | 0.05 |
| fluorescent | 0.07 | 0.07 |
Lead concentrate
Lead concentrate is the concentrate after lead-zinc ore separation, with high lead content and some metal elements such as zinc, copper and iron. The content of each element can be determined simultaneously by using edx-6800a X-ray fluorescence technology, especially the lead concentrate samples produced in the same mine have better effect.
The measurement spectra of lead concentrate are shown below:
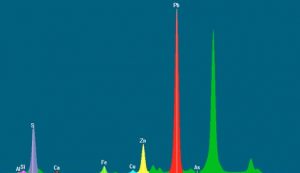
Comparison results of actual samples of lead concentrate
| Sample number | Analysis method | Pb(%) | Zn(%) | Fe(%) | Cu(%) | S(%) | SiO2(%) | CaO(%) | Ag(%) |
| 1-164 | fluorescent | 69.89 | 2.27 | 1.67 | 1.12 | 12.87 | 5.67 | 1.67 | 0.0935 |
| chemical | 70.07 | 2.37 | 1.72 | 1.20 | 13.02 | 5.80 | 1.74 | 0.0962 | |
| 2-172 | fluorescent | 43.98 | 5.59 | 14.89 | 2.57 | 15.63 | 2.67 | 0.87 | 0.0378 |
| chemical | 43.78 | 5.71 | 15.01 | 2.69 | 15.54 | 2.72 | 0.91 | 0.0396 | |
| 3-176 | fluorescent | 51.98 | 5.45 | 9.81 | 2.34 | 21.56 | 2.43 | 0.72 | 0.1897 |
| chemical | 51.74 | 5.61 | 9.92 | 2.27 | 21.49 | 2.33 | 0.75 | 0.1856 | |
| 4-195 | fluorescent | 59.35 | 2.64 | 8.29 | 2.13 | 12.69 | 8.59 | 0.22 | 0.0439 |
| chemical | 59.50 | 2.73 | 8.20 | 2.02 | 12.82 | 8.43 | 0.25 | 0.0429 | |
| 5-199 | fluorescent | 45.65 | 5.56 | 13.43 | 2.74 | 21.78 | 4.12 | 1.24 | 0.0365 |
| chemical | 45.41 | 5.40 | 13.24 | 2.68 | 21.67 | 3.96 | 1.31 | 0.0385 |
Analysis of manganese ore, vanadium ore and nickel ore samples
Edx-6800 instrument, manganese, vanadium, nickel grade analysis, can be used for direct tablet analysis, so the use of edx-6800 X fluorescence analyzer can fully meet the analysis requirements.
Manganese ore is a kind of ore with high economic value. It is generally necessary to analyze the main content of manganese, and sometimes analyze the content of P, Fe2O3, SiO2 and other impurities.
The typical measurement spectra of manganese ore samples are as follows:

The actual analysis results of manganese ore samples are compared as follows:
| Sample number | Analysis method | Mn | P | Fe2O3 | SiO2 |
| 846 | X fluorescence | 18.35 | 0.21 | 3.39 | 34.39 |
| Study | 18.53 | 0.22 | 3.32 | 34.50 | |
| 854 | X fluorescence | 37.78 | 0.07 | 4.09 | 11.95 |
| Study | 37.91 | 0.12 | 4.23 | 12.14 | |
| 855 | X fluorescence | 32.49 | 0.11 | 4.25 | 19.86 |
| Study | 32.30 | 0.08 | 4.36 | 19.78 | |
| 859 | X fluorescence | 1.56 | 0.09 | 1.07 | 61.34 |
| Study | 1.48 | 0.07 | 1.00 | 61.53 | |
| 860 | X fluorescence | 25.50 | 0.23 | 1.04 | 52.52 |
| Study | 25.32 | 0.28 | 1.12 | 52.31 | |
| 862 | X fluorescence | 2.30 | 0.02 | 6.42 | 33.61 |
| Study | 2.42 | 0.01 | 6.60 | 33.55 |
Phosphate rock
Phosphate ore is the main raw material for the production of phosphate fertilizer.
The actual sample analysis results are as follows:
| Sample number | Analysis method | P2O5(%) | Mn(%) |
| 1813 | X fluorescence | 28.71 | 0.44 |
| Study | 28.93 | 0.48 | |
| 1816 | X fluorescence | 26.81 | 0.48 |
| Study | 27.02 | 0.48 | |
| 1823 | X fluorescence | 2.82 | 0.71 |
| Study | 2.95 | 0.74 | |
| 1837 | X fluorescence | 31.23 | 0.36 |
| Study | 31.11 | 0.34 | |
| 1838 | X fluorescence | 8.02 | 0.57 |
| Study | 8.22 | 0.63 |
硫原矿
Sulfur ore mainly exists in the form of pyrite, with high sulfur content, which can be analyzed in only 100 seconds on edx-6800 X fluorescence analyzer.
The actual sample analysis results are as follows:
| Sample number | 1861 | 2127 | 2419 | 2420 | 2275 | 1842 | |
| S(%) | Fluorescence analysis | 31.59 | 15.79 | 17.93 | 12.95 | 17.26 | 6.98 |
| Chemical analysis | 31.39 | 15.50 | 18.02 | 13.18 | 17.37 | 7.23 | |
Analysis of tin and antimony ores
Edx-6800 instrument, tin, antimony and other ore grade analysis, can be used for direct tablet analysis, so the use of edx-6800 X fluorescence analyzer can fully meet the analysis requirements.
X-ray fluorescence tin concentrate test spectra

Example of tin working curve:
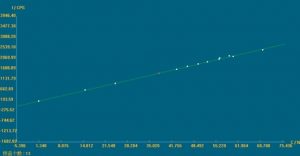
Analysis and comparison results of tin concentrate samples
| Sample name | methods | Sn | As | S | Fe | Si | Ca | Bi | Cu | Pb | Sb | Ag |
| 111118A | study | 55.20 | 0.298 | 0.029 | 5.550 | 0.565 | 0.289 | 0.194 | 4.160 | 0.878 | 0.269 | 0.0080 |
| Fluorspar light | 55.48 | 0.363 | -0.001 | 5.662 | 0.725 | 0.277 | 0.194 | 4.126 | 0.878 | 0.266 | 0.0080 | |
| Poor miss | 0.28 | 0.065 | -0.030 | 0.112 | 0.160 | -0.012 | 0.000 | -0.034 | 0.000 | -0.003 | 0.0000 | |
| 111118B | study | 57.15 | 0.296 | 0.463 | 1.877 | 0.665 | 0.064 | 0.164 | 1.252 | 1.045 | 0.229 | 0.0010 |
| Fluorspar light | 57.20 | 0.312 | 0.245 | 1.786 | 0.418 | 0.083 | 0.172 | 1.345 | 1.046 | 0.192 | 0.0010 | |
| Poor miss | 0.05 | 0.016 | -0.218 | -0.091 | -0.247 | 0.019 | 0.008 | 0.093 | 0.001 | -0.037 | 0.0000 | |
| 111118C | study | 56.40 | 0.296 | 0.029 | 2.060 | 0.714 | 0.064 | 0.158 | 1.434 | 0.494 | 0.210 | 0.0010 |
| Fluorspar light | 56.17 | 0.285 | 0.161 | 2.226 | 0.613 | 0.033 | 0.150 | 1.249 | 0.518 | 0.173 | 0.0010 | |
| Poor miss | -0.23 | -0.011 | 0.132 | 0.166 | -0.10 | -0.031 | -0.008 | -0.185 | 0.024 | -0.037 | 0.0000 | |
| 111118D | study | 56.40 | 0.292 | 0.029 | 2.478 | 0.770 | 0.096 | 0.165 | 1.608 | 0.923 | 0.187 | 0.0010 |
| Fluorspar light | 56.06 | 0.318 | 0.302 | 2.380 | 0.795 | 0.112 | 0.158 | 1.637 | 0.907 | 0.209 | 0.0020 | |
| Poor miss | -0.34 | 0.026 | 0.273 | -0.098 | 0.025 | 0.016 | -0.007 | 0.029 | -0.016 | 0.022 | 0.0000 | |
| 111118E | study | 55.21 | 0.392 | 0.028 | 1.882 | 2.010 | 0.095 | 0.148 | 2.424 | 0.207 | 0.185 | 0.0060 |
| Fluorspar light | 54.97 | 0.277 | -0.045 | 1.811 | 1.935 | 0.096 | 0.154 | 2.494 | 0.204 | 0.207 | 0.0060 | |
| Poor miss | -0.25 | -0.115 | -0.073 | -0.071 | -0.075 | 0.001 | 0.006 | 0.070 | -0.003 | 0.022 | -0.0010 | |
| 111025A | study | 49.76 | 10.650 | 2.043 | 0.348 | 0.147 | 0.064 | 0.068 | 0.000 | 0.645 | 0.452 | 0.0020 |
| Fluorspar light | 49.76 | 10.651 | 2.045 | 0.331 | 0.123 | 0.064 | 0.071 | 0.000 | 0.648 | 0.466 | 0.0020 | |
| Poor miss | 0.00 | 0.001 | 0.002 | 0.017 | -0.024 | 0.000 | 0.003 | 0.000 | 0.003 | 0.014 | 0.0000 | |
| 111025B | study | 29.72 | 19.710 | 4.580 | 0.298 | 0.326 | 0.064 | 0.070 | 0.000 | 0.961 | 0.621 | 0.0020 |
| Fluorspar light | 29.72 | 19.707 | 4.579 | 0.413 | 0.322 | 0.064 | 0.068 | 0.000 | 0.960 | 0.613 | 0.0020 | |
| Poor miss | 0.00 | -0.003 | -0.001 | 0.115 | -0.004 | 0.000 | -0.002 | 0.000 | -0.001 | -0.008 | 0.0000 | |
| 111024A | study | 0.00 | 0.200 | 0.809 | 2.985 | 3.490 | 0.096 | 0.127 | 0.577 | 0.634 | 0.078 | 0.0020 |
| Fluorspar light | 0.00 | 0.386 | 0.812 | 2.791 | 3.512 | 0.101 | 0.117 | 0.579 | 0.649 | 0.097 | 0.0010 | |
| Poor miss | 0.00 | 0.186 | 0.003 | -0.19 | 0.022 | 0.005 | -0.010 | 0.002 | 0.015 | 0.019 | 0.0000 | |
| 111024B | study | 55.56 | 0.396 | 0.636 | 0.199 | 2.346 | 0.064 | 0.117 | 0.306 | 0.358 | 0.081 | 0.0010 |
| Fluorspar light | 55.96 | 0.229 | 0.593 | 0.128 | 2.419 | 0.053 | 0.107 | 0.270 | 0.343 | 0.105 | 0.0030 | |
| Poor miss | 0.40 | -0.167 | -0.043 | -0.071 | 0.073 | -0.011 | -0.010 | -0.036 | -0.015 | 0.024 | 0.0020 | |
| 111024C | study | 51.85 | 0.296 | 0.664 | 0.693 | 3.490 | 0.064 | 0.094 | 0.472 | 0.503 | 0.069 | 0.0030 |
| Fluorspar light | 51.96 | 0.294 | 0.616 | 0.880 | 3.259 | 0.080 | 0.106 | 0.532 | 0.495 | 0.052 | 0.0020 | |
| Poor miss | 0.11 | -0.002 | -0.048 | 0.18 | -0.231 | 0.016 | 0.012 | 0.060 | -0.008 | -0.017 | -0.0010 | |
| 111111A | study | 32.63 | 0.196 | 0.466 | 0.589 | 20.480 | 0.064 | 0.102 | 0.000 | 0.000 | 0.112 | 0.0020 |
| Fluorspar light | 32.62 | 0.197 | 0.469 | 0.549 | 20.483 | 0.062 | 0.111 | 0.000 | 0.000 | 0.111 | 0.0020 | |
| Poor miss | -0.02 | 0.001 | 0.003 | 0.050 | 0.003 | -0.002 | 0.009 | 0.000 | 0.000 | -0.001 | 0.0000 |
Molybdenum analysis
Molybdenum ore is analyzed by ELITE 600 fluorescence analysis, which can analyze samples from various content ranges such as molybdenum raw ore, tailings, concentrate and medium ore, etc. Direct tablet measurement can be performed。
The results are as follows:
| Sample name | Mo-chemical | Mo-fluorescent | ERROR | DATE |
| 0.0074 | 0.0074 | 0.0081 | 0.0007 | 10-09-21-15:17 |
| 0.008 | 0.008 | 0.0086 | 0.0006 | 10-09-21-12:59 |
| 0.0081 | 0.0081 | 0.0084 | 0.0003 | 10-09-21-13:14 |
| 0.0085 | 0.0085 | 0.0085 | 0 | 10-09-21-14:06 |
| 0.0091 | 0.0091 | 0.0092 | 1E-04 | 10-09-21-13:24 |
| 0.0096 | 0.0096 | 0.0092 | -0.0004 | 10-09-21-15:48 |
| 0.0101 | 0.0101 | 0.0096 | -0.0005 | 10-09-21-12:53 |
| 0.0181 | 0.0181 | 0.0181 | 0 | 10-09-22-15:32 |
| 0.0564 | 0.0564 | 0.057 | 0.0006 | 10-09-22-09:22 |
| 0.0694 | 0.0694 | 0.0728 | 0.0034 | 10-09-21-16:31 |
| 0.0721 | 0.0721 | 0.0883 | 0.0162 | 10-09-21-16:40 |
| 0.0762 | 0.0762 | 0.0805 | 0.0043 | 10-09-22-10:20 |
| 0.0946 | 0.0946 | 0.0991 | 0.0045 | 10-09-21-16:58 |
| 0.1647 | 0.1647 | 0.1598 | -0.0049 | 10-09-22-10:24 |
| 0.2829 | 0.2829 | 0.289 | 0.0061 | 10-09-22-11:49 |
| 0.381 | 0.381 | 0.388 | 0.007 | 10-09-22-12:59 |
| 0.4293 | 0.4293 | 0.4148 | -0.0145 | 10-09-22-14:31 |
| 0.4428 | 0.4428 | 0.4399 | -0.0029 | 10-09-22-13:08 |
| 0.4727 | 0.4727 | 0.4788 | 0.0061 | 10-09-22-13:14 |
| 0.6162 | 0.6162 | 0.624 | 0.0078 | 10-09-22-13:55 |
| 0.7042 | 0.7042 | 0.669 | -0.0352 | 10-09-22-15:16 |
| 0.8388 | 0.8388 | 0.8689 | 0.0301 | 10-09-22-15:20 |
| 0.9286 | 0.9286 | 0.9238 | -0.0048 | 10-09-22-15:26 |
| 1.0287 | 1.0287 | 0.7136 | -0.3151 | 10-09-22-16:56 |
| 1.1717 | 1.1717 | 1.1668 | -0.0049 | 10-09-22-16:09 |
| 1.1891 | 1.1891 | 1.1054 | -0.0837 | 10-09-23-09:56 |
| 1.2017 | 1.2017 | 1.5108 | 0.3091 | 10-09-23-10:00 |
| 1.706 | 1.706 | 1.8119 | 0.1059 | 10-09-22-16:04 |
| 1.7077 | 1.7077 | 1.6315 | -0.0762 | 10-09-22-15:47 |
| 1.8862 | 1.8862 | 1.7517 | -0.1345 | 10-09-22-17:00 |
| 2.0334 | 2.0334 | 2.0452 | 0.0118 | 10-09-22-16:25 |
| 4.195 | 4.195 | 4.3058 | 0.1108 | 10-09-23-08:55 |
| 4.3091 | 4.3091 | 4.2032 | -0.1059 | 10-09-23-10:12 |
| 5.4641 | 5.4641 | 5.4699 | 0.0058 | 10-09-22-17:04 |
| 5.8249 | 5.8249 | 5.621 | -0.2039 | 10-09-23-09:47 |
| 5.909 | 5.909 | 6.0327 | 0.1237 | 10-09-22-17:08 |
| 6.4768 | 6.4768 | 6.4522 | -0.0246 | 10-09-23-09:29 |
| 8.841 | 8.841 | 11.1112 | 2.2702 | 10-09-23-10:17 |
| 9.171 | 9.171 | 9.7608 | 0.5898 | 10-09-23-09:43 |
| 9.2729 | 9.2729 | 9.2611 | -0.0118 | 10-09-23-08:39 |
| 10.1597 | 10.1597 | 10.0958 | -0.0639 | 10-09-23-09:51 |
| 11.3044 | 11.3044 | 10.5375 | -0.7669 | 10-09-23-09:33 |
| 12.3495 | 12.3495 | 12.6537 | 0.3042 | 10-09-23-08:50 |
| 13.1882 | 13.1882 | 13.2033 | 0.0151 | 10-09-23-08:59 |
| 14.2526 | 14.2526 | 14.3622 | 0.1096 | 10-09-23-09:16 |
| 14.987 | 14.987 | 14.4119 | -0.5751 | 10-09-23-09:21 |
| 15.0392 | 15.0392 | 15.132 | 0.0928 | 10-09-23-08:46 |
| 15.4131 | 15.4131 | 14.7979 | -0.6152 | 10-09-23-09:25 |
| 16.842 | 16.842 | 17.0358 | 0.1938 | 10-09-23-09:08 |
| 18.4832 | 18.4832 | 18.1617 | -0.3215 | 10-09-23-09:12 |
| 22.1608 | 22.1608 | 21.9232 | -0.2376 | 10-09-23-10:34 |
| 23.6019 | 23.6019 | 24.3608 | 0.7589 | 10-09-23-10:38 |
| 26.817 | 26.817 | 26.5883 | -0.2287 | 10-09-23-10:21 |
| 31.9525 | 31.9525 | 31.8375 | -0.115 | 10-09-23-10:52 |
| 33.789 | 33.789 | 33.2439 | -0.5451 | 10-09-23-10:47 |
| 34 | 34 | 33.6491 | -0.3509 | 10-09-23-10:30 |
| 35.189 | 35.189 | 35.271 | 0.082 | 10-09-23-11:41 |
| 36.1441 | 36.1441 | 36.1445 | 0.0004 | 10-09-23-11:10 |
| 36.1441 | 36.1441 | 36.0134 | -0.1307 | 10-09-23-10:25 |
| 36.309 | 36.309 | 36.26 | -0.049 | 10-09-23-11:23 |
| 36.46 | 36.46 | 36.8008 | 0.3408 | 10-09-23-11:46 |
| 36.8803 | 36.8803 | 36.1839 | -0.6964 | 10-09-23-11:54 |
| 40.0574 | 40.0574 | 40.5688 | 0.5114 | 10-09-23-12:41 |
| 40.1742 | 40.1742 | 40.0379 | -0.1363 | 10-09-23-12:46 |
| 42.02 | 42.02 | 42.8664 | 0.8464 | 10-09-23-13:12 |
| 44.2658 | 44.2658 | 44.2761 | 0.0103 | 10-09-23-13:20 |
| 44.3309 | 44.3309 | 44.6559 | 0.325 | 10-09-23-13:29 |
| 46.893 | 46.893 | 46.824 | -0.069 | 10-09-23-13:47 |
| 47.4665 | 47.4665 | 47.4222 | -0.0443 | 10-09-23-13:33 |
| 48.7838 | 48.7838 | 49.0721 | 0.2883 | 10-09-23-12:54 |
| 50.2899 | 50.2899 | 49.8053 | -0.4846 | 10-09-23-13:55 |
| 51.5996 | 51.5996 | 51.3247 | -0.2749 | 10-09-23-13:51 |
Analysis of silicates such as silica
Edx-6800a instrument can be used for direct tablet analysis of silica samples, so the use of edx-6800a X-ray fluorescence analyzer can fully meet the analysis requirements.
Silicate samples include: clay, shale, feldspar, quartz, sandstone and other samples, widely used.
Actual silicate measurement sample results are as follows:
| Sample number | Analysis method | SiO2(%) | Al2O3(%) | Fe2O3(%) | CaO(%) | MgO(%) | Na2O(%) | K2O(%) |
| GSD-8 | Fluorspar light | 83.07 | 7.59 | 2.03 | 0.30 | 0.23 | 0.46 | 2.79 |
| Study | 82.89 | 7.70 | 2.20 | 0.24 | 0.25 | 0.47 | 2.84 | |
| GSD-9 | Fluorspar light | 64.80 | 10.43 | 4.94 | 6.19 | 2.55 | 1.66 | 1.96 |
| Study | 64.89 | 10.58 | 4.86 | 6.35 | 2.39 | 1.44 | 1.99 | |
| GSR-2 | Fluorspar light | 60.90 | 16.30 | 4.70 | 5.10 | 1.73 | 3.93 | 1.73 |
| Study | 60.62 | 16.17 | 4.90 | 5.20 | 1.72 | 3.86 | 1.89 | |
| GSR-4 | Fluorspar light | 90.08 | 3.34 | 3.06 | 0.17 | 0.04 | 0.04 | 0.55 |
| Study | 90.36 | 3.52 | 3.22 | 0.30 | 0.08 | 0.06 | 0.65 | |
| GSR-6 | Fluorspar light | 15.21 | 4.82 | 2.39 | 35.72 | 4.96 | 0.73 | 0.67 |
| Study | 15.60 | 5.03 | 2.52 | 35.67 | 5.19 | 0.78 | 0.65 | |
| GSS-1 | Fluorspar light | 62.91 | 13.93 | 5.31 | 1.81 | 1.70 | 1.44 | 2.56 |
| Study | 62.60 | 14.18 | 5.19 | 1.72 | 1.81 | 1.66 | 2.59 | |
| GSS-2 | Fluorspar light | 73.03 | 10.49 | 3.45 | 2.50 | 1.12 | 1.76 | 2.58 |
| Study | 73.35 | 10.31 | 3.52 | 2.36 | 1.04 | 1.62 | 2.54 |
Application of mx-2 handheld instrument in nonferrous mining industry
The mx-2 handheld fluorescence analyzer can be used for the rapid test of various black and non-ferrous mining samples on the spot analysis, without the need for complex sample preparation, as long as the sample is simply put into the sample cup can be directly measured, can also be directly measured on the ore, powder.
The grade of raw ore, tailings, concentrate and medium ore can be determined quickly.The following is a molybdenum mine for example, mx-2 test molybdenum concentrator each link of the rapid determination of mineral samples.
| Mo(%) | |||
| 标样编号 | 化学分析 | 荧光分析 | 误差 |
| 1-8p | 0.028 | 0.028 | 0.000 |
| 1p | 0.021 | 0.020 | -0.001 |
| 2p | 0.025 | 0.024 | -0.001 |
| 3p | 0.018 | 0.020 | 0.002 |
| 4p | 0.018 | 0.019 | 0.001 |
| 5p | 0.018 | 0.016 | -0.002 |
| 8p | 0.023 | 0.022 | -0.001 |
| 9p | 0.015 | 0.021 | 0.006 |
| 10p | 0.024 | 0.028 | 0.004 |
| 11p | 0.030 | 0.027 | -0.003 |
| 1-9p | 0.043 | 0.047 | 0.004 |
| 1-10p | 0.025 | 0.021 | -0.004 |
| 1-11p | 0.058 | 0.058 | 0.000 |
| 1-12p | 0.039 | 0.032 | -0.007 |
| 1-13p | 0.023 | 0.025 | 0.002 |
| 1-14p | 0.061 | 0.060 | -0.001 |
Comparison results of molybdenum ore samples
| Mo(%) | |||
| Sample number | Chemical analysis | Fluorescence analysis | Error |
| 1p | 0.130 | 0.120 | -0.010 |
| 2p | 0.134 | 0.121 | -0.013 |
| 3p | 0.120 | 0.102 | -0.018 |
| 4p | 0.110 | 0.108 | -0.002 |
| 5p | 0.105 | 0.096 | -0.009 |
| 6p | 0.180 | 0.177 | -0.003 |
| 7p | 0.130 | 0.141 | 0.011 |
| 0.102 | 0.102 | 0.110 | 0.008 |
| 0.1 | 0.100 | 0.099 | -0.001 |
| 0.121 | 0.121 | 0.124 | 0.003 |
| 0.083 | 0.083 | 0.099 | 0.016 |
| 0.118 | 0.118 | 0.118 | 0.000 |
| 0.087 | 0.087 | 0.083 | -0.004 |
| 0.088 | 0.088 | 0.096 | 0.008 |
| 0.093 | 0.093 | 0.108 | 0.015 |
Comparison results of molybdenum concentrate samples
| Mo(%) | Cu(%) | Pb(%) | P(%) | |||||||||
| Sample number | chemical | fluorescent | error | chemical | fluorescent | error | chemical | fluorescent | error | chemical | fluorescent | error |
| 1-4 | 48.00 | 47.98 | -0.02 | 1.160 | 1.148 | -0.012 | 0.128 | 0.115 | -0.013 | 0.018 | 0.017 | -0.001 |
| 2 | 49.91 | 50.26 | 0.35 | 0.464 | 0.457 | -0.007 | 0.015 | 0.014 | -0.001 | |||
| 3 | 48.91 | 49.69 | 0.78 | 0.377 | 0.390 | 0.013 | 0.109 | 0.110 | 0.001 | 0.015 | 0.015 | 0.000 |
| 4 | 48.10 | 47.78 | -0.32 | 0.454 | 0.446 | -0.008 | 0.136 | 0.121 | -0.015 | 0.017 | 0.017 | 0.000 |
| 5 | 48.12 | 47.85 | -0.27 | 0.898 | 0.905 | 0.007 | 0.261 | 0.263 | 0.002 | |||
| 6 | 49.84 | 49.19 | -0.65 | 0.614 | 0.627 | 0.013 | 0.127 | 0.114 | -0.013 | 0.014 | 0.016 | 0.002 |
| 7 | 50.96 | 50.71 | -0.25 | 0.519 | 0.543 | 0.024 | 0.144 | 0.137 | -0.007 | 0.011 | 0.015 | 0.004 |
| 8 | 49.51 | 49.58 | 0.07 | 0.399 | 0.401 | 0.002 | 0.256 | 0.255 | -0.001 | 0.015 | 0.016 | 0.001 |
| 1-1 | 51.70 | 50.89 | -0.81 | 0.276 | 0.269 | -0.007 | 0.122 | 0.145 | 0.023 | 0.016 | 0.016 | 0.000 |
| 9 | 49.96 | 50.53 | 0.57 | 0.467 | 0.475 | 0.008 | 0.090 | 0.093 | 0.003 | 0.013 | 0.015 | 0.002 |
| 10 | 50.45 | 50.80 | 0.35 | 0.343 | 0.342 | -0.001 | 0.116 | 0.117 | 0.001 | 0.012 | 0.014 | 0.002 |
| 11 | 51.45 | 51.65 | 0.20 | 0.258 | 0.255 | -0.003 | 0.115 | 0.112 | -0.003 | 0.010 | 0.014 | 0.004 |
| 1-5 | 49.63 | 50.50 | 0.87 | 0.209 | 0.222 | 0.013 | 0.055 | 0.067 | 0.012 | 0.015 | 0.013 | -0.002 |
| 1-6 | 51.38 | 50.99 | -0.39 | 0.307 | 0.290 | -0.017 | 0.038 | 0.036 | -0.002 | 0.017 | 0.016 | -0.001 |
| 1 | 49.07 | 49.52 | 0.45 | 0.406 | 0.376 | -0.030 | 0.082 | 0.084 | 0.002 | 0.021 | 0.017 | -0.004 |
| 1-2 | 52.60 | 51.66 | -0.94 | 0.100 | 0.107 | 0.007 | 0.096 | 0.107 | 0.011 | 0.018 | 0.013 | -0.005 |
| average error | 0.453 | 0.011 | 0.007 | 0.002 | ||||||||
Comparison results of crude concentrate samples
| Mo(%) | |||
| Sample number | Chemical analysis | Fluorescence analysis | error |
| 2 | 3.700 | 4.200 | 0.500 |
| 3 | 6.270 | 6.680 | 0.410 |
| 4 | 7.010 | 6.720 | -0.290 |
| 5 | 7.530 | 7.240 | -0.290 |
| 6 | 4.580 | 4.320 | -0.260 |
| 7 | 3.310 | 3.640 | 0.330 |
| 8 | 7.700 | 7.850 | 0.150 |
| 9 | 3.300 | 3.050 | -0.250 |
| 10 | 4.630 | 4.320 | -0.310 |


