|
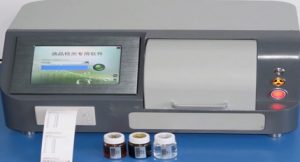
Solution for pulp analysis applicationEdx-300ms special X fluorescence analyzer
Edx-300ms X fluorescence analyzer is a high precision X fluorescence analyzer with advanced technology level.Fast and exact analysis, it is mainly used for pulp can analyze the Ca, Fe, Ti, V, Cr, Mn, Ni, Cu and zinc, Pb, Sn, Mo, Ag, Cd, Ba, S, P, such as the content of each element, 100 seconds to complete rapid determination of all elements, analysis of element content can range from PPM level to the pure elements and does not require complicated sample preparation process.
Instrument features
Technical characteristics and parameters of the instrument1 Technical characteristics
D.Electronic circuit system with high signal-to-noise ratio. Four automatic filters, software automatic switching, meet the application of various testing methods, reduce the background intensity near the analysis elements, improve the detection limit of analysis. The multi-parameter linear regression method can obviously suppress the absorption and enhancement effect between elements and improve the accuracy of analysis. High efficiency 3 d heat dissipation system: greatly provides the reliability and stability of the instrument. Radiation safety system: concealed design, software and hardware triple ray protection system. 2 Technical parameters
Examples of sulfur concentrate spectra Examples of original (middle) ore spectrum: Tailings instance
Examples of sulfur working curve:
According to the technological conditions of the concentrator, curve calibration is carried out for pulp samples at different technological stages. Mainly: concentrate curve, original (middle) ore curve, tailings curve. 20 corresponding standard samples should be prepared for each working curve. A cup measurement method using pulp after preliminary dehydration, realize the request of error is less than 50%. The whole sample preparation analysis time is less than 5 minutes, in order to solve the fineness on the result of analysis, using the same technology section of the characteristics of the sample fineness were small, calibration samples for different process section curves and sample measurement method. |


